From very early in their math education, young students learn about different ways to represent data. In earlier grades, this means being introduced to pie charts, bar charts, and line graphs. As learners move into high school, however, the lessons will naturally become more challenging, but many of the skills they will have learned will help them adapt.
One valuable skill high school math students will learn is how to read, interpret, and create histograms. Relying on the lessons learned from classes on bar charts in previous school years, children will be able to represent different ranges of data on a histogram.
Of course, many children will be entering high school math classes with gaps in their knowledge. This is not ideal, and while there are ways to plug any holes in their knowledge, you’re about to see just how easy histograms can be to read, interpret, and create yourself.
What Is A Histogram?
Defined as a graphical display of data using bars of different heights, a histogram is a brilliant way to represent continuous numerical data. We can group data into two groups, known as descriptive and numerical, and then we group numerical data into two further subgroups, discrete and continuous. Discrete data is counted, while continuous data is measured.
Continuous data is data that can change, such as someone’s height, someone’s weight, or how much time elapsed during a race. These are the kinds of data that we represent on histograms.
On a histogram, just like on a bar chart, bars of different heights are used, but on a histogram, these bars correspond to a range of numbers. The height of the bar tells us how many fall into each range.
Reading And Interpreting Histograms
Let’s take a look at an example of a histogram, identify its characteristics, and interpret some results.
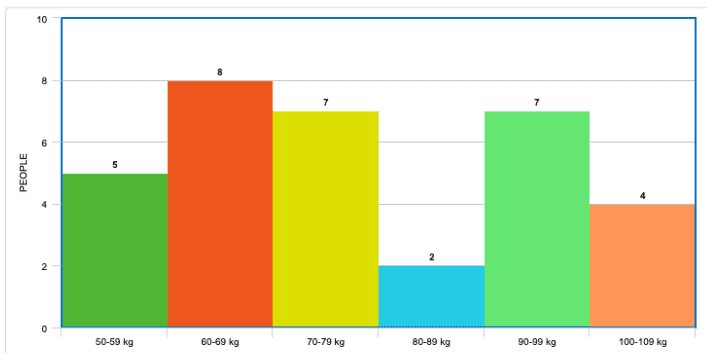
Here, we can see that up the y-axis, we have the number of people, and across the x-axis, we have groups of weights. We can see that this histogram is going to tell us how many people fall into each of these different categories of weight.
We can see that more people fell in the 60-69kg range than any other, while the 80-89kg range had the fewest number of people in it.
What we have learned from this particular set of data is not what’s important. What is important to learn from this histogram is that we plot our ranges across the x-axis, and we plot out numerical value of whatever we are measuring up the y-axis.
We also decide on what value to give our ranges across the x-axis, that is to say, whether we group them within a range of 5, 10, 20, 50, or any other range we determine appropriate. Always remember to keep your ranges equal for each bar on the histogram, we can’t have some bars representing a range of 5 and the next representing a range of 10.
Creating Histograms
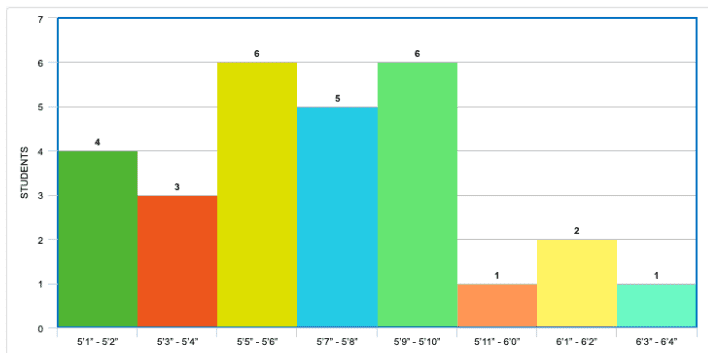
By carrying forward the knowledge we just gain by analyzing that particular histogram, we can easily get to work on creating our own. Let’s say we are measuring a group of classmates’ height. There are 28 students in the class, and they are all between 5’1” and 6’4”.
Since there are 16 inches between 5’1” and 6’4”, we can decide that the range of each bar will be 2”. This range is known as the class interval. Therefore, we know we will have 8 steps along our x-axis.
To plot our y-axis, we must find out how many students fall into the ranges we have determined. The results are as follows:
5’1” – 5’2”: 4
5’3” – 5’4”: 3
5’5” – 5’6”: 6
5’7” – 5’8”: 5
5’9” – 5’10”: 6
5’11” – 6’0”: 1
6’1” – 6’2”: 2
6’3” – 6’4”: 1
We can choose to plot our y-axis in increments of 1 since the difference between the highest value and the lowest value is just 6. Now that we have our information ready to draw. Let’s create our histogram on this free histogram creator. Here’s how our histogram looks now.
Young math students can try out the free histogram creator, but it is very important to practice drawing out the graphs for themselves. Using the creator as a verification tool is a clever way to check homemade graphs.
OMC Math Courses For High School Students
OMC offers extensive options to young math students looking to be successful in high school math. We understand that each student is different, some want 1-1 tutoring to plug holes in their knowledge, while others may need additional general high school math lessons, to keep up with or get ahead of classmates. There are also dedicated SAT preparation courses to make sure all bases are covered before the most important math exam of a student’s life.
Regardless of your child’s math needs, contact OMC today and enroll them in the course that suits their needs.