Let’s be honest, statistics sounds intimidating. The thought of having to analyze data and place it into some type of chart or graph does not sound like a fun Saturday night. However, statistics can be fun and valuable- and all it takes is a little practice. We previously discussed the basics of probability and statistics. But what about the rest of statistics?
Before we dive in, let’s recap what we already know. The 3 key terms in statistics are mean (average), median (middle), and mode (most common). A range is the difference between the largest and smallest numbers in the set of data. Probability is the likelihood of an event occurring. Now that we’ve reviewed Statistics 101, let’s try 102.
Measures of Central Value
If you are given 2 numbers and asked to find the central value, you simply meet halfway between the values; essentially the same concept as adding the values and dividing by 2. Let’s look at the central value between 5 and 9 which is 7. If you have 3 numbers, you would take all 3 values, add them, and divide by 3. This is the method to find the mean. Sometimes we may find that the mean and median are actually the same value. In the example of the values 5 and 9, we know that the mean is 7 but so is the median. This is because it is in the middle of the set of data.
Aside from the mean, median, and mode, there are other values that you may be looking for when looking at a spread of data. When looking at a set of data, we may find what are called outliers. These are values that lie outside of the others. For example, if all test scores in the class are between 25 and 30 but one student scores a 98, that score is the outlier. Any outliers can certainly change the mean (average) of the data since they are far from the majority of the information, so there may be instances where they are ignored when calculating the mean and simply noted separately.
Measures of Spread
As we know, the range is the difference between the largest and smallest values in a set of data. However, a range can be misleading if there is an outlier. If the students in class all scored between 25 and 30 with one score of 98 as the outlier, the range would then look to be 25 – 98. This is certainly confusing. In these situations, it is better to use quartiles or standard deviation.
Quartiles
In quartiles, the data is split into 4 sections. The values are placed in order from smallest to largest, then cut into 4 equal parts. Each quartile is at the “cut”. An interquartile range can also be used where you would subtract Q1 from Q3. Another option to organize the data would be using a box and whisker plot.
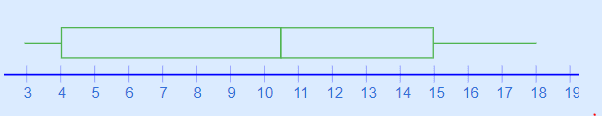
In this plot, you would again organize the data from smallest to largest, split into 4 quarters, and draw a vertical line over each “cut” on a number line. You would then connect all 3 cuts, creating 2 adjacent boxes and finally draw a horizontal line out to the smallest value and largest value, stopping right above that number. Here’s a visual representation of a box and whisker plot below. Any guesses on where the cuts are in this example?
Standard Deviation
Standard deviation is a measure of just how spread out the values are in a set of data. The symbol for this is the Greek letter σ “sigma”. To find the standard deviation, we take the square root of the variance. The variance is the average of squared differences from the mean. To find the variance, you would first find the mean. Then you would find out the difference of each value from said mean, square them, add together, and divide by the number of values.
Here is an example below:
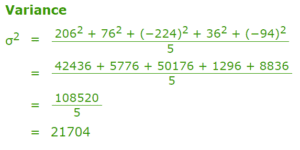
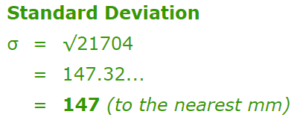
To find the standard deviation, you take the square root of the variance (21,704) which in this example would be 147.32.
Probability 102
We know that probability is how likely something is to happen. The probability of winning a million dollars, the probability of being the 100th caller, the probability of almost anything happening! When calculating this, you would take the number of ways it could happen and divide by the total number of outcomes. If you have a bag of 3 blue marbles and 6 green ones, the probability of pulling a blue one would be 3 (blue) out of 9 (total), which comes to 1 out of 3, also 0.33333, equal to 33%.
You could also show the probability on a probability line. Since probability is typically explained as a value from 0 to 1, the line would show “Impossible” (0) to “Even Chance” (0.5) to “Certain” (1). In this example, the probability was 0.33, making it Unlikely. While probability provides us with a numerical value, it is only a guide. This means the chance of pulling the blue marble is unlikely, but not impossible.
At OMC
Statistics and probability are important high school topics but go beyond the classroom. In any field, statistics is an important component. Whether it is used to perform jobs or even to display data about the job or field, it is a subject that will follow through adulthood.
At Online Math Center, we ensure that all students leave our school with a deep understanding of relevant statistics concepts such as central value, standard deviation, probability, and more. It may not come easily at first, but at OMC we offer classes and tutoring that will assist students in strengthening foundational topics like these in mathematics. OMC works to ensure that every student reaches or surpasses their full potential in math class and beyond.
Contact OMC today to help ensure your child gains a solid, complete understanding of the most important mathematical concepts, like statistics, by signing them up for classes that are tailored to their specific educational needs.